Dashboard Filters
- In the 17.2 release, the My Team control has been moved to the dashboard filter panel. As with the My Team control, it allows you to select from either direct reports, or managed organizations, provided the user has access to one or both.
- If direct reports option is selected, it defaults to include all of the current users direct reports, and this can be changed to only show data for one or some of the direct reports listed.


-
If Managed Organization is selected (the default,) a list of all the organizations that the current user manages directly is listed, and defaults to All. In edit view, the selection can be changed to one or some of the organizations.
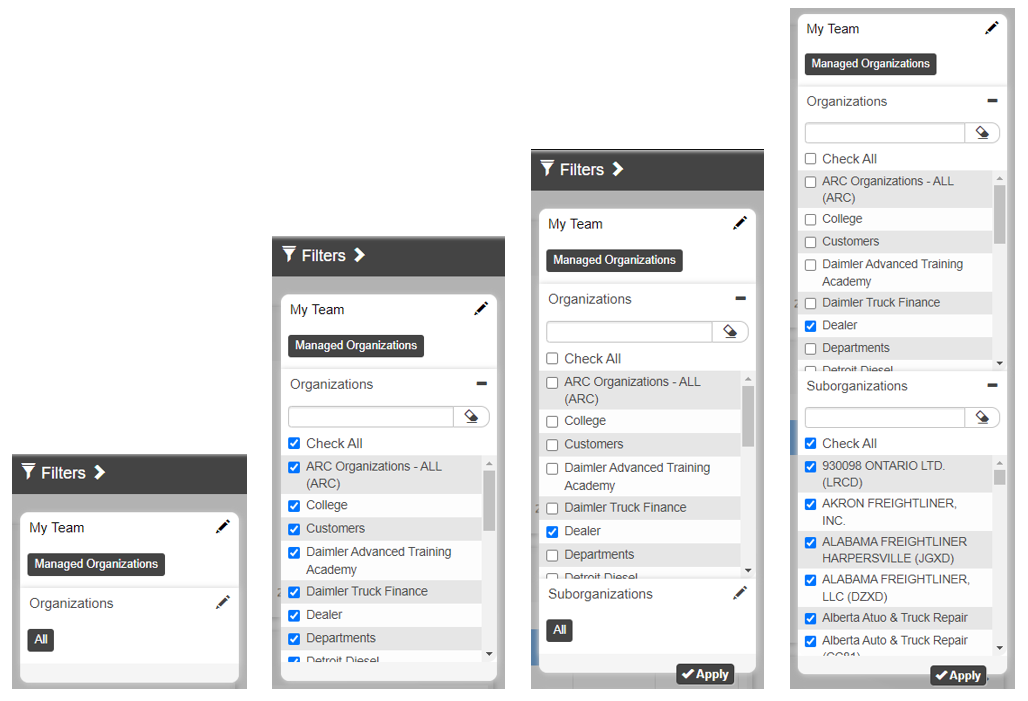
- If just one organization is selected, and that organization has suborganizations, and the current user has access to view the descendants of that organization - a suborganization filter will be shown, defaulting to all, and can be edited as with the main organization filter.
- A single Apply button appears when a change to the My Team has been made, and when clicked will apply the changes to the dashboard. The team selection, once applied, will be stored and recalled the next time the dashboard is loaded.
- If direct reports option is selected, it defaults to include all of the current users direct reports, and this can be changed to only show data for one or some of the direct reports listed.
- When filter settings are modified and applied by a user they are saved to the database for that dashboard on that campus. Because the filters on each campus are stored separately, each time you run the dashboard for the first time on a particular campus, you will see the default filters to start with.
- When filters are applied, the filter button changes color and shows a star that indicates that one or more filters changes have been made.
- The filters that have been altered from the default are indicated by an asterisk following the filter title.
- The filters can be reset to the defaults by clicking the Reset Filters button in the filters header.
- Unlike Sisense, drilldowns are accessed by a left click, and are opened in a new browser tab.
- Filters from the calling dashboard are carried forward to the drilldown.
- Filters on the drilldown can be changed, but are not saved because it takes them from the calling dashboard
- The My Team filter is shown, but is not editable from the drilldown
Dashboard Notes
Goal Overview
- All widgets other than the pivot table and the Team Members widget have drilldowns
Goal Status
- Status By Activity - Shows a breakdown of progress of the activities on the selected goal.
Development Plan Status
- This dashboard was released and shows both overall plan progress as well as goal and activity status.
- There are drilldowns on all except for the Avg. Plan % Complete, and Active Plans widgets.
Certification Progress
- This dashboard shows certification progress, both for certifications on development plans and those that are not on plans.
- There are drilldowns on all widgets.
The Course Activity Status dashboard
- Shows course activity, irrespective of development plan assignment.
- Includes
- Progress breakdowns for WBT and ILT
- Breakdown of attempts on course sessions
- Median minutes spent per course.
- Ranking reports for courses based on the number of sessions started.
- Unique users and average sessions per user.
- The data can be filtered by course, and the timeframe in which the sessions were started, in addition to standard user filters.
- Course Activity Rank drilldown
- This links to the Course Session Status pivot table
Certification Activity Progress
- Shows progress of certification activities on users’ development plans.
- The dashboard reports on the same data as the Certification Progress dashboard but provides an alternate, quick glance view.
Team Activity
- Shows a broad view of activity for the selected team, including logins, and goal, activity, certification, curricula, and course completions as well as content views.
- Can be filtered by a timeframe filter.
Instructor Led training Activities
- Provides information about instructor lead training classes, including
- how many where scheduled and offered
- how many users where trained
- cancellation rate.
- It also shows a breakdown by month of classes that are active, inactive, cancelled, and complete, and a breakdown of in-person verses virtual classes.
- My Team is not used on this dashboard as it’s meant as an overall view, but the results can be filtered by timeframe.
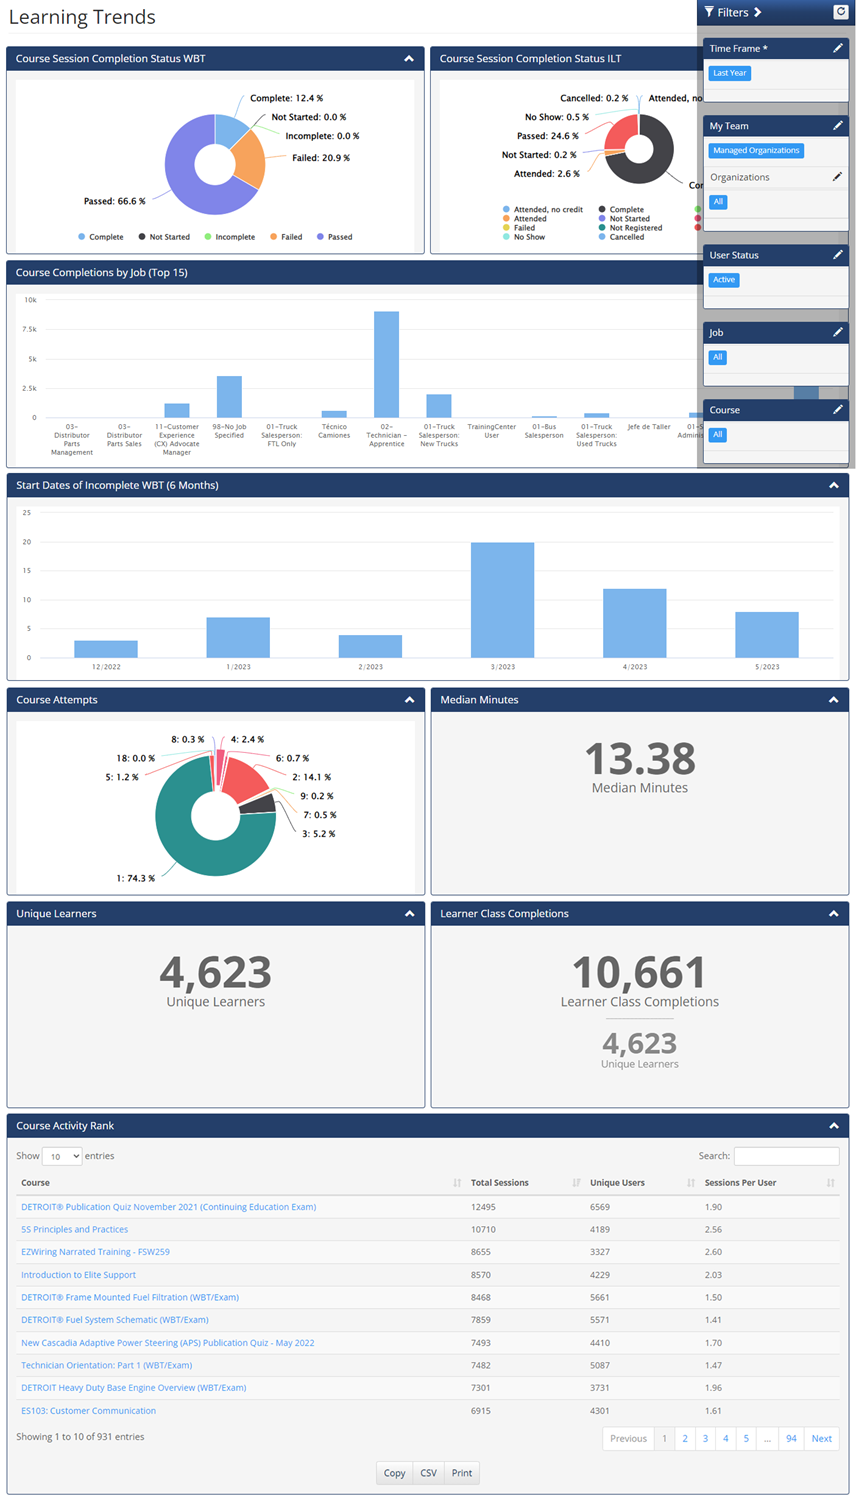
Learning Trends Dashboard
The learning Trends dashboards shows a variety of metrics - not to measure a teams performance, but rather to evaluate use of training in the platform. The My Team and Timeframe filters are included, among others.
Included Charts
- Two Course Session Completion charts, one for WBT and one for ILT. These charts show the breakdown of course statuses in each of these categories.
- The top 15 job groups who have completed the most courses.
- The number of courses that have been started but not completed in the last 6 months.
- A breakdown of the number of attempts taken to complete WBT courses – only completed courses are counted.
- The average median minutes taken to complete WBT courses.
- The number of unique learners who have completed one or more ILT courses in the timeframe, and the total number of classes completed in the timeframe.
- A ranking of Courses, both WBT and ILT, showing the total number of user sessions, the number of unique users who have sessions, and the average number of sessions per user for the given course. The sorting can be changed to view the courses in the order preferred.